

Delhi was choking on Diwali night. Firecrackers continued to light up the sky, smoke hung over neighbourhoods and pollution levels shot up.
But as residents tried to make sense of the air they were breathing, the systems meant to track and display pollution appeared to be telling an incomplete story.An India Today ground investigation found that while monitoring stations recorded extremely high concentrations of particulate matter, public display screens at two locations were switched off or unavailable. Online dashboards, meanwhile, did not appear to reflect live changes during the team's checks.The gaps became even more apparent the following morning, when two public-facing platforms appeared to offer very different pictures of Delhi's air quality.
A digital screen outside the India Meteorological Department (IMD) office showed an Air Quality Index (AQI) of 143, categorised as 'moderate'.At around the same time, the Central Pollution Control Board (CPCB) dashboard showed an AQI of approximately 343, in the 'very poor' category, for Lodhi Road, where the IMD office is located. That is a difference of 200 points between the two displayed figures.
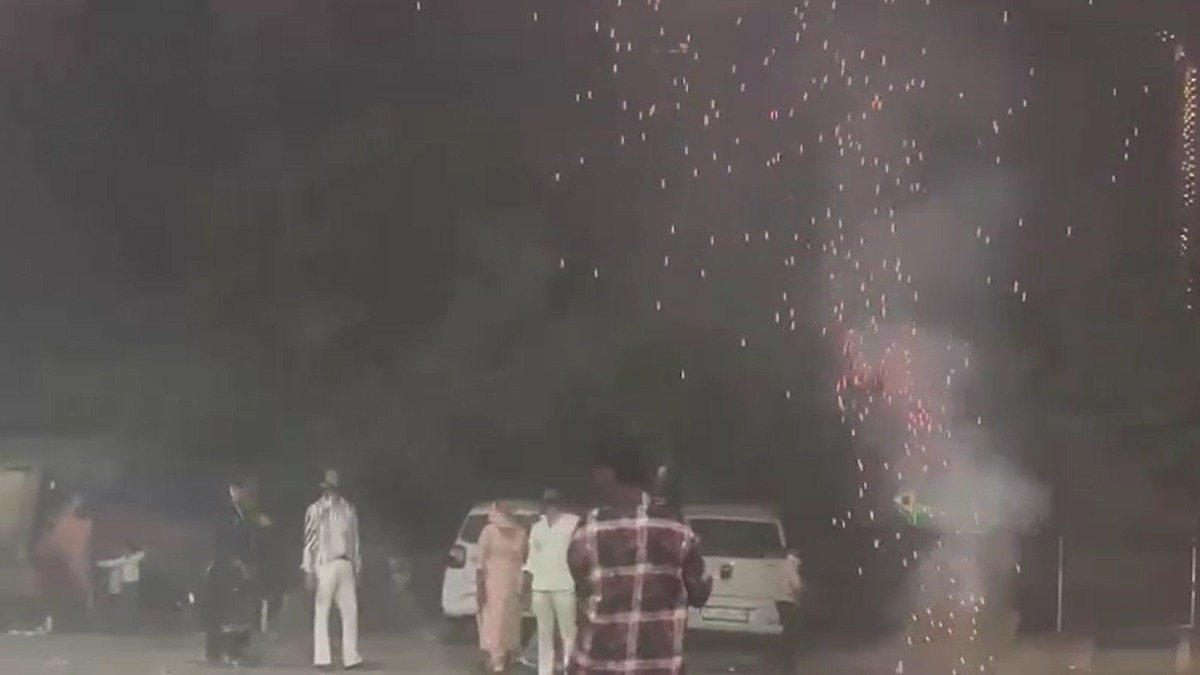
However, the source station, update time and averaging period of the IMD screen's reading could not be established, leaving it unclear whether the readings were directly comparable.IMD officials told the reporting team that the screen outside its office was managed by the Delhi Pollution Control Committee (DPCC). So, while Delhi residents were being asked to keep an eye on pollution levels and take precautions, the bigger question was whether the information available to them was current, consistent and reliable.CRACKERS DID NOT STOP, AQI KEPT RISINGTo understand what was happening on the ground, our reporters hit the streets on Diwali night, when firecracker bursting was at its peak.
The idea was to see not just how polluted Delhi's air had become, but also how its government monitoring system was responding.The 10 pm deadline for bursting crackers had passed, but the celebrations were far from over. At Dwarka Sector 8, crackers were being burst close to the air-quality monitoring station itself, even as its display recorded extraordinarily high particulate matter concentrations.A few minutes past 11 pm, the station showed PM2.5 at 1,727 micrograms per cubic metre and PM10 at 2,005 micrograms per cubic metre.
At around 11.30 pm, the PM2.5 reading remained elevated at 1,725 micrograms per cubic metre.The picture was no different at ITO. Around 1 am, its monitoring station displayed a PM2.5 concentration of 994 micrograms per cubic metre.These were concentrations of fine particulate matter in the air, not AQI figures.
Under CPCB's National AQI framework, PM2.5 concentrations above 250 micrograms per cubic metre fall in the 'severe' category. However, the station's short-term readings cannot be directly converted into AQI values, which are calculated using specified averaging periods.But the problem was not limited to what the physical monitoring stations were recording.
It was also about what people looking at online dashboards could see.The online AQI values checked alongside the physical station readings were 403 for Dwarka and 407 for ITO. During the team's observations, the online dashboard did not appear to reflect the changing readings in real time.For someone checking pollution levels on a phone or computer, this raises a basic question: if pollution levels are changing rapidly, how useful is an online dashboard if residents cannot establish when its information was last updated?The issue is not simply whether two numbers match.
PM2.5 concentration and AQI measure different things. What matters is whether the platforms clearly communicate the source and age of the information they display, particularly during sudden pollution spikes.THE SCREENS THAT WENT DARKAnd it wasn't just the online information that raised questions.
The ground investigation found that residents could not access pollution readings through public display screens at two monitoring locations either.At the NSIT Dwarka monitoring station, a guard told the reporting team that the public display board had been switched off at 9 pm.At Lodhi Road, another guard said an AQI monitor was installed but readings were no longer being displayed publicly.For residents, this meant that the very screens meant to provide information about local air quality were offering no readings when pollution was a major concern.There is an important distinction here. The unavailable public displays do not establish that the monitoring stations had stopped measuring pollution or transmitting data.
But they do raise questions about why the information was not being made accessible on the screens and whether residents were provided an alternative way to check it.A monitoring station may continue collecting data in the background. But if its readings are not visible to the public, one of the most direct ways residents have of understanding local pollution disappears.'MODERATE' OUTSIDE IMD, 'VERY POOR' ON CPCB DASHBOARDThe questions over access to pollution information did not end with the Diwali-night checks.
The following morning brought another striking observation.Outside the IMD office, a high-tech digital screen displayed an AQI of 143, suggesting 'moderate' air quality. At around the same time, the CPCB dashboard showed approximately 343 for Lodhi Road, placing it in the 'very poor' category.For a resident looking at the two platforms, the difference would be difficult to ignore.
One indicated relatively moderate conditions, while the other pointed to a much more polluted morning.IMD officials told the reporting team that the digital screen was managed by DPCC. Its location outside the weather department's office, therefore, did not necessarily mean that IMD was responsible for the readings being displayed.But several details remained unclear.
Which monitoring station was feeding the screen? When had the information last been updated?
Was the displayed figure based on an hourly reading, a rolling average or another calculation?Without these details, it cannot be established whether the two platforms were displaying comparable readings or whether one was carrying older data.The distinction is important because AQI readings can vary depending on the monitoring station, pollutant concentrations and averaging periods used. CPCB's AQI framework uses specified averaging periods, including 24-hour averages for PM2.5.
A sudden spike in particulate matter over a short period may therefore not be reflected at the same level in the published AQI.A CITY UNDER SMOG, BUT WHERE IS THE CLEAR PICTURE?The ground investigation also captured the larger picture of Diwali night. From Dwarka to Sardar Patel Marg, Lodhi Road, central Delhi and Connaught Place, thick smog hung over the capital.
Firecrackers continued to be burst beyond the 10 pm deadline, including outside the Dwarka Sector 8 monitoring station.Pollution was visible across the capital, monitoring station displays were recording extremely high particulate matter concentrations, but the public-facing systems did not always offer residents a clear and consistent picture.The findings do not establish that government monitoring equipment was malfunctioning or that AQI figures were deliberately misreported. They do, however, raise important questions about the reliability, timeliness and accessibility of public pollution information.Why were the public display boards switched off?
When were the online dashboards last updated during the Diwali-night checks? Which monitoring station supplied the reading displayed outside IMD?
And why was the screen showing 'moderate' air quality while the CPCB dashboard indicated 'very poor' conditions for Lodhi Road?Delhi residents are routinely told to check AQI levels before stepping outdoors, limiting physical activity and taking precautions when pollution worsens. But that advice assumes that the information available to them is current and understandable.When the air turns toxic, residents need more than monitoring stations collecting numbers somewhere in the background.
They need to know what those numbers mean, where they come from and when they were last updated.On Diwali night, Delhi's air was telling one story. Its public-facing AQI systems were not always telling residents the whole of it.- Ends